The Only Spring of Knowledge

I teach in an urban district, in a poor neighborhood where >90% of our students are on free or reduced lunch. The schools in our neighborhood have been making strides, but have regularly been on the state’s naughty list with regards to success. There are already enough discussions of why it got this way and how to fix it and who to blame on the internet, and I don’t have the time to waste on that anyway. I choose to focus on my classroom, and what I can do (or can’t do).

I’ve spent a good deal of time in the last couple months reading and taking ideas from some prominent math teacher bloggers from around the country who are true innovators in terms of content and rigor of their courses. One of the biggest revelations of getting caught up in math teacher blogging world is realizing how limited most of my students truly are. I know its oversimplifying it to say it this way, but most of my students are functionally illiterate! They could read through a passage and say most of the words correctly, but if there is a new word (particularly a math term) they struggle to sound it out. Then if I ask another student to rephrase or summarize, I first get word for word quotes. If I keep pushing, maybe that one particular kid can save everyone else from their dumbfounded silence.

They didn’t teach me this in my undergrad, but illiteracy is equally as disabling in math as it is in English, history, or any other course that typically carry the torch for reading and discussion.

When students choose not to read because they don’t understand it anyway, they become primarily auditory and visual learners. They want to hear everything or see pictures. I don’t mind catering to those needs and am doing my best. However, it leaves me as the only spring of knowledge in the room.

I have tried to adapt group work packets from some of my favorite math bloggers like this one (which I stole almost completely from Kate Nowak), only to have my classroom devolve into social hour because the students are busy waiting for me to come around and explain the questions to them and walk them through step by step, even when I have written out hints beside the questions. Many never learned to struggle through a problem and evaluate their answers based on other resources.I think this is one of the things that makes teaching so exhausting for me. I have to do everything for many of the students.

Part of this is venting, but also a call for ideas. How would you react in this situation? I know there is no magic bullet, but I want my students to realize the value of becoming more self-directed and responsible learners. How would you communicate that?
M&M’s pt. 2

So the M&M’s distribution activity went fairly well (now a week and a half later…) . I used Fathom to aggregate their data into a large table as they tabulated the counts of each color. Color was our main variable, but we also tracked the total counts and the mass of each bag.

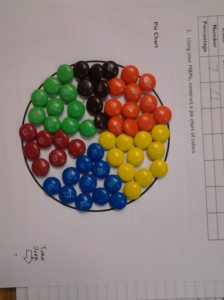
2013-08-15 08.32.48I went around with a tablet and took pictures of the pie charts they made with their M&M’s which automatically uploaded to my computer through Dropbox’s camera upload feature! We scrolled through roughly 15 pie charts and compared them while the students marinated over the task of looking for a pattern. Turns out they thought they saw orange and green a lot and but not a lot of brown.

Later we used Fathom to summarize the distributions of each person’s color counts together. We found that Orange was the most popular color, with blue and green roughly tied for second.

13-14 m&m count meansLater we compared it to the “true” distribution numbers another AP Statistics teacher had obtained from the company and were able to discuss the causes of variance and whether they had potentially changed their distribution since the data had been sent from the company.

We also began to look at displays of a quantitative variable because they were interested in looking at the number of M&M’s per bag and the mean mass of the bags.

The students had a good time with it and we had a good chance to talk about what we could infer from the data.

M&Ms

AP Stat students will love me tomorrow. Their third period teachers? Not so much…

2013-08-13 20.44.18

Got the idea for using M&Ms to illustrate distributions of categorical variables and pie charts from my AP summer institute. Look out for some follow ups after tomorrow.


Realizing I had not thought that one through…

Last year, my school purchased class sets of TI Nspire CX calculators with wireless Navigator systems. Be still my nerdy heart! These things are awesome. I can use the wireless capabilities to conduct polls during class, obtaining immediate assessment data. Then I can reveal a bar chart of all inputted answers, and we can discuss the positive merits of wrong answers along with where they went wrong. Game changer!

Navigator Poll Screenshot


The difficult thing about this transition is the massive leap students have to make to learn the whole new paradigm behind these calculators, when they were used to the TI 84 model. The Nspires function much more like a computer, where you create documents, and each document has pages which can contain either a calculator, graph, spreadsheet, statistical graph, text editor, or a data collection app (if you have the attachments). The keypad is incredibly different than the 84’s and they are just miles apart.

Anticipating the difficulty of this gap, I wanted to find something to help them feel more familiar and less overwhelmed with the new calculator. A quick search of the TI Education website revealed this scavenger hunt by Lois Coles for an earlier version of the Nspire. I adapted it, changing the buttons, and maybe adding a few things. I was in first year teacher mode, and didn’t think much more of it.

This year, I made a few quick edits and came up with this:

I used this as an in class activity, giving students plenty of time and the chance to work together. I tried to take all the pressure of “getting the right answer” off and explained the goal was really just to familiarize themselves with the calculator.

Within the first 20-30 minutes of using the activity this year, I realized it just didn’t fit.

  1. Now that I teach AP Stat, Precal, and Geometry, I realized the way my students will regularly be using the calculators in each class looks very different.
  2. The activity itself just doesn’t cover things that are really that important. Why in the world do my students need to know what color the numbers are?

I started an evernote list during class with a few key questions/notes, such as: “should target more practical skills,” and “why show them how to plot points on the calculator? we don’t do that in class.”

I am also being inspired by Amber Caldwell’s post on Calculator Boot Camp. She mentions a focus on practicing key calculator skills at the beginning of the year. They get the experience, but are still doing appropriately challenging math.

I think next year’s iteration will be different and more targeted for every class, so they can get specific skills relevant to their individual course.