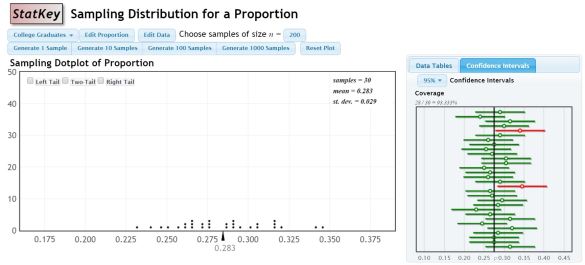
Last year, I introduced confidence intervals using an applet. There are lots of them out there, but this is my favorite. I like that it simultaneously shows the proportions on a dot plot and constructs the confidence intervals off to the side for each sample.
My problem with introducing it this way is that I’m concerned that since the data is pre-loaded, and not something familiar to the students, it’s hard to connect to.
I wanted to essentially create the same experience, but let it be with data the students collected. I wasn’t aware of a program that would let me input the information for the sample proportion then also graph the lines for the confidence interval as well. Then I remembered seeing a function in Plot.ly called error bars!
My Plan:
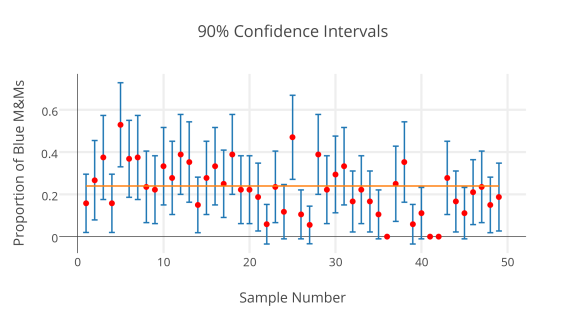
Recently, my students took data on proportions of M&Ms in fun size bags of M&Ms, letting each one be a “sample” of all M&Ms. I am going to print out sets of 3 samples on individual slips, and redistribute them to students, so that once again, all students have different data to work with. They will calculate 95% and 90% confidence intervals for each sample, and then will send me the proportion and their margin of error through a Google Form. I will use plot.ly to create one graph of the 95% intervals and another of the 90% intervals, so that we can compare and contrast, and look for those that “miss” the true proportion.
The Nitty-Gritty-Plot.ly-Magic:
- Open up the Plot.ly Workspace
- Since I’ll have each student calculating 2 versions of the CI for each of their 3 samples, I’m using a google form on which they will enter their sample number (on the sheet I’m giving them), the proportion of Blue M&Ms in their sample, and the margin of error for the 90% CI and the margin of error for the 95% CI.
- Use the Make a Plot button at the top to choose scatterplot. In the left menu, select Error Bars.
- Copy the data from the google form responses into the plot.ly spreadsheet. You will have to relabel the columns in plot.ly if you just copy and paste. I also create a column that contains 0.24 over and over again, since this is the true proportion of blue M&Ms advertised by the company.
- I plan to make my intervals, so I will have the Sample number as the x, the proportion as the y, and the margin of error for one of the CI’s be the Ey (error in the y direction).
- Scroll to the bottom of the left menu and select the blue Scatter Plot button.
- To add a horizontal line that represents the true proportion, I went back to the grid tab, then used the Make a Plot button to select Line Plot. I turned off the variable choices in the columns, and then chose Sample number as x and the true proportion column as y. At the bottom of the left hand menu, use the Insert Into dropdown to select the graph tab 2. Then hit Line plot for it to be added to that same graph.
Here’s my practice run:
I think we may get another snow day tomorrow. If so, I may do a screen recording video. (Now I’m thinking that would have taken less time if I had just done that in the first place…)

