Using Plot.ly to Make Confidence Intervals

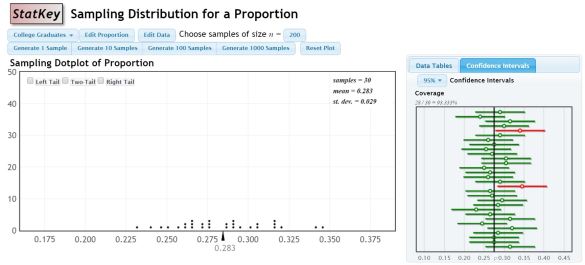
Last year, I introduced confidence intervals using an applet. There are lots of them out there, but this is my favorite. I like that it simultaneously shows the proportions on a dot plot and constructs the confidence intervals off to the side for each sample.

Capture

My problem with introducing it this way is that I’m concerned that since the data is pre-loaded, and not something familiar to the students, it’s hard to connect to.

I wanted to essentially create the same experience, but let it be with data the students collected. I wasn’t aware of a program that would let me input the information for the sample proportion then also graph the lines for the confidence interval as well. Then I remembered seeing a function in Plot.ly called error bars!

My Plan:

Recently, my students took data on proportions of M&Ms in fun size bags of M&Ms, letting each one be a “sample” of all M&Ms. I am going to print out sets of 3 samples on individual slips, and redistribute them to students, so that once again, all students have different data to work with. They will calculate 95% and 90% confidence intervals for each sample, and then will send me the proportion and their margin of error through a Google Form. I will use plot.ly to create one graph of the 95% intervals and another of the 90% intervals, so that we can compare and contrast, and look for those that “miss” the true proportion.

The Nitty-Gritty-Plot.ly-Magic:

  1. Open up the Plot.ly Workspace
  2. Since I’ll have each student calculating 2 versions of the CI for each of their 3 samples, I’m using a google form on which they will enter their sample number (on the sheet I’m giving them), the proportion of Blue M&Ms in their sample, and the margin of error for the 90% CI and the margin of error for the 95% CI.
  3. Use the Make a Plot button at the top to choose scatterplot. In the left menu, select Error Bars.
  4. Copy the data from the google form responses into the plot.ly spreadsheet. You will have to relabel the columns in plot.ly if you just copy and paste. I also create a column that contains 0.24 over and over again, since this is the true proportion of blue M&Ms advertised by the company.
  5. I plan to make my intervals, so I will have the Sample number as the x, the proportion as the y, and the margin of error for one of the CI’s be the Ey (error in the y direction).
  6. Scroll to the bottom of the left menu and select the blue Scatter Plot button.
  7. To add a horizontal line that represents the true proportion, I went back to the grid tab, then used the Make a Plot button to select Line Plot. I turned off the variable choices in the columns, and then chose Sample number as x and the true proportion column as y. At the bottom of the left hand menu, use the Insert Into dropdown to select the graph tab 2. Then hit Line plot for it to be added to that same graph.

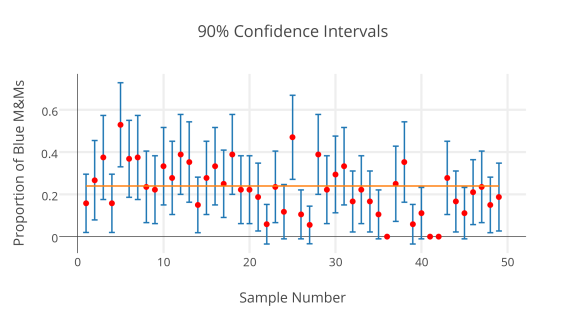
Here’s my practice run:

9025_confidence_intervals

I think we may get another snow day tomorrow. If so, I may do a screen recording video. (Now I’m thinking that would have taken less time if I had just done that in the first place…)
Would you Rather: Hypothesis testing

I am teaching Type I and Type II Errors Monday and wanted to get students thinking through the problem of balancing the probability of the two errors. I want them to understand the tension and realize they will not be able to eliminate either possibility. I plan to do this before actually introducing the names for the types of errors. I just wrote up these two “Would you rather?” scenarios. I would love some feedback or some other suggestions to use as follow up.

For the two scenarios below, decide which error would be worse. Clearly state your answer and your reasoning.

Scenario 1

As a doctor, you see a large national study that 35.9% of Americans are now considered obese (H_0:p=.359). Alternatively, you think it may be possible that your patients are below the national average (H_a:p<.359). If you conduct a hypothesis test on a sample of your patients, which would be worse?

a.Rejecting the null hypothesis and stating that less than 35.9% of your patients are obese when in fact your patients are in line with the national average.
-or-
b. Failing to reject the null hypothesis that your patients match the national average, when in fact less than 35.9% of your patients are obese?

Scenario 2

You are a researcher. Patients using the current treatment for lung cancer go into remission 55% of the time (H_0:p=.55). You believe that you have found an improved treatment (H_a:p>.55). Which would be worse?

a. Rejecting the null hypothesis and stating that your treatment is better when in fact it is not.
-or-
b. Failing to reject the null hypothesis that your treatment is equal to the current treatment, when in fact it is better.

Rich Problem Solving – Experimental Design

I’m currently in the middle of Fall Break. As each moment goes by outside of school I regain a bit of my prior sanity, and am able to reconnect to goals and heart of my teaching philosophy. Conveniently, the week of fall break also coincides with the first challenge of the Explore the MTBoS Mission 1: Explore the power of the blog.

I found out about this challenge as school was starting and planned to be blogging all the way until it started and use it as a jumpstart to keep me going. Now, instead, its the jumper cables that hopefully will push me to keep growing during what has turned out to be a REALLY busy and stressful year. Turns out three new preps take up all my time.

I want to respond to the first challenge in brainstorm mode, as I feel that I have not done a great job so far this year (in any of my three preps) of teaching through rich problems. However, in AP Statistics in particular, I want to continue to replace the math in their heads (a loose collection of skills each with an associated step by step process) with struggle and critique and logic.

One overarching topic of the AP Statistics class is experimental design. Students are to engage in the art of creating surveys, studies, etc. in order to minimize bias and examine conjectures statistically. As the majority of my students have little exposure to reading about research, doing or taking surveys, I am interested to throw them in the deep end and see what they think is reasonable for experimental design.

I envision setting up a class near the beginning of the experimental design section as a role-playing scenario, where students are asked to take on the role of researchers trying to answer some big question about their community. In the beginning, I would give them little guidance, just a promise that throughout our unit we will continue to improve this research plan and build up to the point where we may actually be able to carry out a survey or experiment at the end of the unit that gives reliable data. As we discuss ideas such as bias, sampling, and blocking,  I would like to allow students time to synthesize the new ideas by making successive revisions to their research plans.

What I envision struggling with here is scaffolding the initial brainstorming activity for my students. The urban education system they have grown up in has made it very difficult for them to speculate, apply, or create new knowledge without having very explicit modeling first. I want to push them to move into a new topic even though they have little background knowledge and be willing to put something on paper even though they know it will not be good.

I’m thinking I will have them brainstorm based on a series of basic questions about designing an experiment. For example, “What data are we trying to obtain? How will we obtain that data from our participants?” and so on. Maybe I will have them read articles about research for a few days leading into this topic in order to answer questions about the researchers purpose and methods.

Any better ideas on how to scaffold them into this or more questions I could have them work through? Any scientists out there have a sample of the things that you would do to plan a study before you do it?

M&M’s pt. 2

So the M&M’s distribution activity went fairly well (now a week and a half later…) . I used Fathom to aggregate their data into a large table as they tabulated the counts of each color. Color was our main variable, but we also tracked the total counts and the mass of each bag.

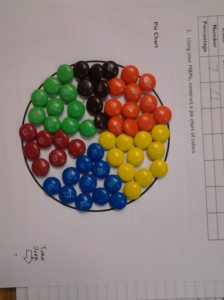
2013-08-15 08.32.48I went around with a tablet and took pictures of the pie charts they made with their M&M’s which automatically uploaded to my computer through Dropbox’s camera upload feature! We scrolled through roughly 15 pie charts and compared them while the students marinated over the task of looking for a pattern. Turns out they thought they saw orange and green a lot and but not a lot of brown.

Later we used Fathom to summarize the distributions of each person’s color counts together. We found that Orange was the most popular color, with blue and green roughly tied for second.

13-14 m&m count meansLater we compared it to the “true” distribution numbers another AP Statistics teacher had obtained from the company and were able to discuss the causes of variance and whether they had potentially changed their distribution since the data had been sent from the company.

We also began to look at displays of a quantitative variable because they were interested in looking at the number of M&M’s per bag and the mean mass of the bags.

The students had a good time with it and we had a good chance to talk about what we could infer from the data.